Benefits
Using Data to Solve Real Problems in Benefits Administration
How a strategic analyst mindset can improve compliance, reduce participant confusion, and streamline internal processes.
Introduction: Benefits Data Isn’t Just a Checklist
Benefits administration is often seen as reactive: answer participant questions, fix system errors, stay compliant. But what if we flipped that? What if data could help us prevent issues instead of just responding to them?
Good data analysis doesn’t just keep you compliant. It helps you uncover patterns, reduce friction, and improve outcomes for everyone involved: participants, HR teams, and administrators.
Problem #1: Participants Are Losing Money
It’s common to see frequent claims denials, appeals, and forfeitures. Often, this isn’t carelessness; it’s confusing plan rules, lack of timely reminders, or misunderstandings about eligibility.
What I did:
-
Pulled participant inquiry data and grouped them into the most common categories: denials, appeals, and forfeitures (excluding general balance inquiry or basic questions).
-
Reviewed trends in Excel and Python to ascertain why denied claims and forfeitures happened.
-
I categorized issues by plan type, timing (beginning, middle, or end of the plan year), and employer.
-
I identified patterns in when and why participants were losing money. There were some employers where many participants had made the exact same mistake. This indicates an education issue about benefit rules, which is something my company can help with.
-
I presented my superiors with a solution to implement education materials for all participants and recommended that we gear our materials toward participants, and not just to HR/employers.
Outcome:
This led to clearer participant education materials, better CS scripts, and a measurable reduction in repeated support cases.
Problem #2: System Errors Were Delaying Open Enrollment
One year, a client’s open enrollment was nearly derailed by constant system crashes. The culprit? Gigantic census files with subtle inconsistencies.
What I did:
-
Used Excel and the AbleBits add-on to compare new vs. prior census files.
-
Built logic to flag discrepancies before upload.
-
Prevented broken formatting, misaligned headers, and duplicate records.
Example
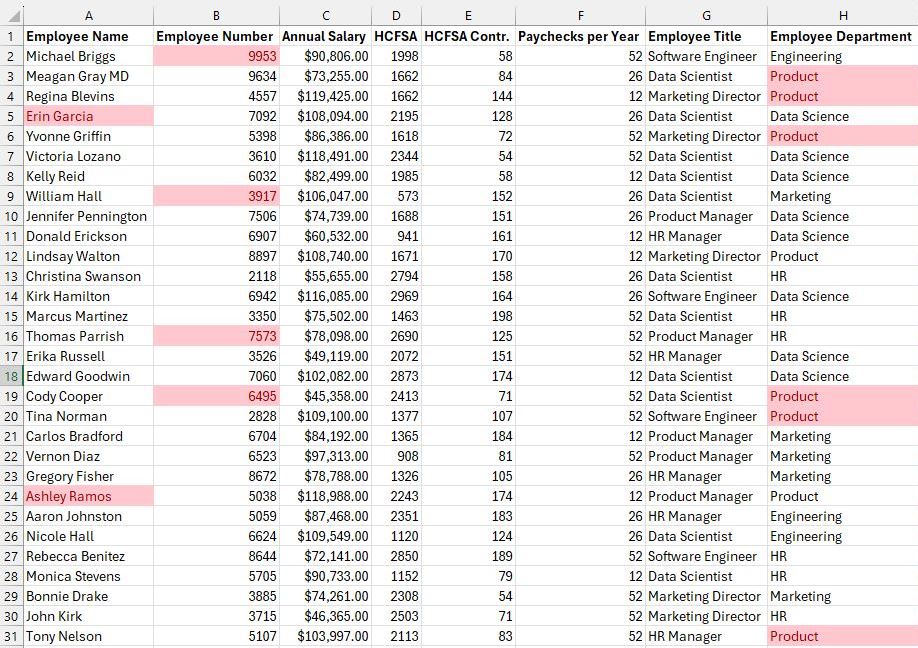
Here is an example of Excel data that has been compared via Ablebits. This data was generated with Python’s Faker library (for generating mock data). Using AbleBits, I can show where the data doesn’t match my current records (in red).
Outcome:
This stopped system crashes, reduced manual cleanup, and helped the client launch OE on time without participant confusion.
Problem #3: Customer Service Was Drowning in Questions
Over 1,300 emails and 200+ calls per employer per day were coming in. The Customer Service team was swamped.
What I did:
-
Analyzed logs of support calls and emails.
-
Identified top question categories and recurring participant pain points.
-
Created education documents, internal training, and plan summaries.
-
I also presented an idea to my superiors that we implement biweekly customer service trainings to mitigate common misunderstandings.
Outcome
Repeat inquiries dropped, CS morale improved, and participant satisfaction rose. We also instituted monthly team trainings informed by live support data.
Bottom Line: Benefits Data = Business Intelligence
When used well, benefits data reveals behavioral patterns, communication breakdowns, and systemic inefficiencies.
As a data analyst with benefits domain expertise, I don’t just look at numbers. I seek to understand why they matter, who they impact, and how to make them better.
Want to transform your benefits program with smarter insights?
Let’s talk about how data can strengthen both your compliance and your participant experience. Let’s connect
